Click here to download this week's dataset as a CSV
Click here to download this week's dataset as a Hyper Extract
Data Viz Round Up
Jim Van Sistine
Jim approached the viz from Mickey’s point of view, all the way from his narrative text to his tooltips (which featured some very nice viz in tooltips!). He looked at how the characters appeared in the films together, using a Sankey to show the amount of interactions between the characters. Additionally, he used a scatterplot to build a timeline showing the character’s appearances over time, with some helpful highlighting actions.
Follow Jim on Tableau Public Follow Jim on Twitter
Shawn Moore
A nice clean visualization looking at the IMDB ratings of each of the 130 Mickey Mouse films by year. His tooltips pull in all of the pertinent information about the film that the user is hovering over.
Follow Shawn on Tableau Public
Adam Lenau
Adam's first ever Tableau Viz! Adam used a scatter plot to visualize the films by release date and director. He also leveraged some free text filters on the plot summary and character fields to add some interesting interactivity. Give it a shot and search for ‘fight’ or ‘fire’ or one of your own ideas.
Follow Adam on Tableau Public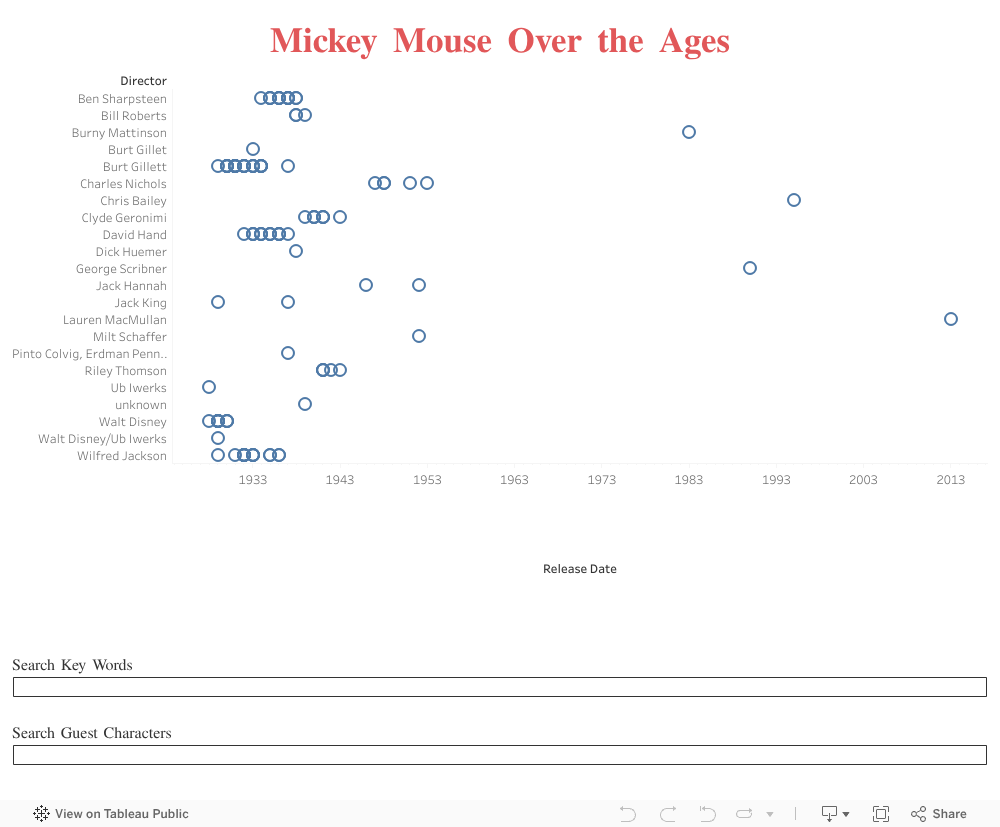
David Velleca
I wanted to look at how the characters appeared together in the 130 films. I focused on the ‘main characters’ and used an arc Sankey to show the interactions. I created some calculated fields to work with a parameter to let the user highlight specific interactions. Additionally, I included a ‘timeline’ of sorts using a stacked shape chart that shows all of the films, highlighting the films that the chosen character appears in with Mickey.
Follow Me on Tableau Public Follow me on Twitter Check out my blog Follow @TThrowbackThurs on Twitter
Data Source
This week's dataset comes from Wikipedia. Please be sure to cite the source on your viz.